Part 2 - Understanding The Horse Racing Price
Movement Data
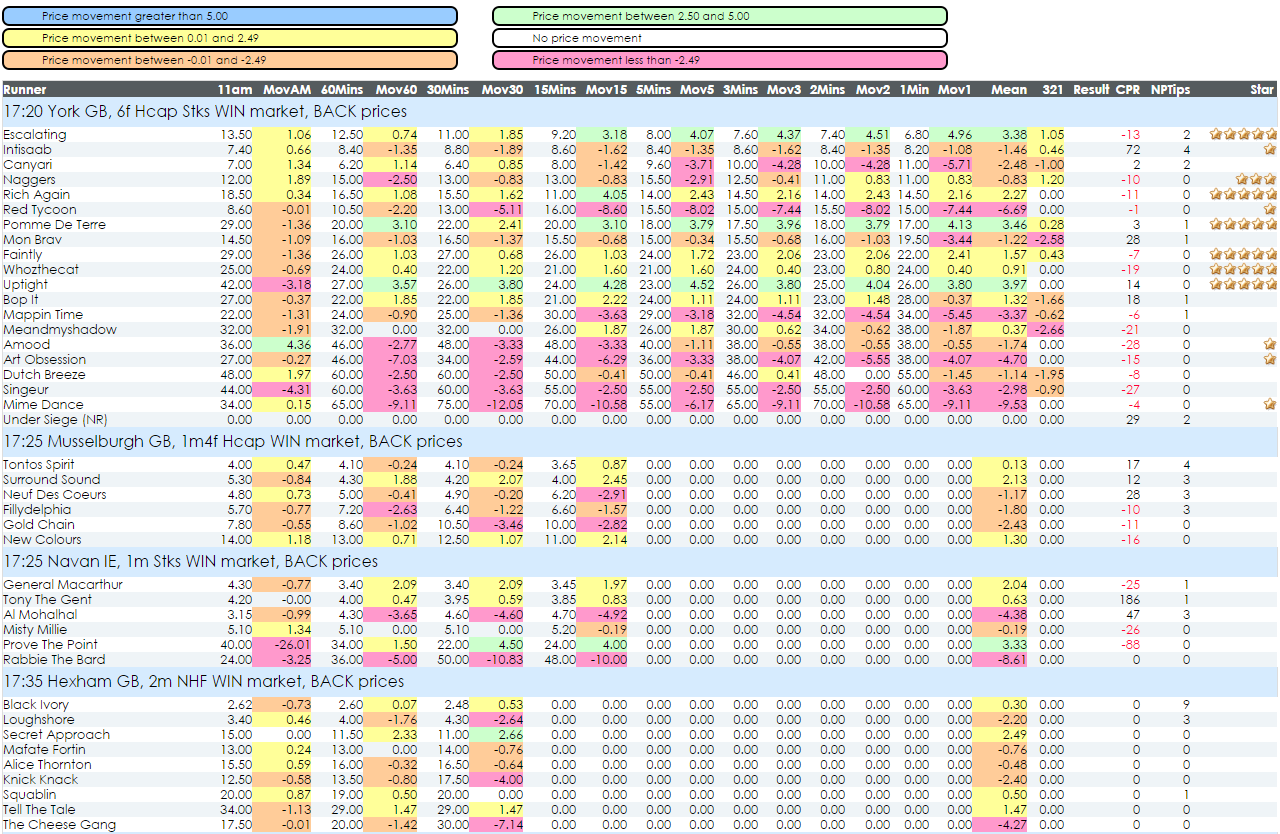
Below is a screenshot of the JustStartHere Upcoming
Races page (win market, back
prices):

Click on the image above to enlarge
The prices for each race are recorded in the morning (9.00am/10.00am/11.00am) and then 60 minutes,
30 minutes and every minute from 15 minutes through to 1 minute before the scheduled post
time. You can choose to display a maximum of one morning price and seven other prices
from your "My Account" page. The prices from 60 minutes to post time onwards are compared
against the selected comparison price (9.00am/10.00am/11.00am/60 minutes) to produce
the "Mov" values (percentage-based movement calculations). These are colour-coded to clearly
indicate which horses are steamers and which are drifters. The "MovAM" values are based
on the price movements between 9.00am and 11.00am.
The final average price movement
(Mean) is calculated and displayed at 1 minute before the off along with the 321 value which
compares the prices at 3 minutes and 1 minute before post time. This is when the majority of money
is exchanged on betting exchange horse racing markets and therefore the most important time to
monitor where the money's going. Again, these figures are colour-coded according to the nature and
size of price shift to clearly identify the steamers and the drifters in the
market.
You'll also notice the star ratings
on the right-hand side. These also appear at 1 minute before post time and are the result of a
calculation that takes into account how much the prices have steamed in throughout the day (with
particular attention paid to the last few minutes before the off). The general idea is that 5 star
horses are worthy of attention because they have attracted a lot of money whilst horses with no
stars have drifted in the betting.
Please note that the Mov values and
star ratings on the lay screens are inverted - i.e.
they're intended to highlight potential lay selections (those which you might consider betting on
to lose).
Part 3 - Examples Of How The
Price Movement Data Can be Used
|